Methodology
Some diseases may exhibit multiple epidemic waves within a season rather than a single peak. This method extends the seasonal onset and burden level framework to identify multiple waves.
Burden levels are used to determine when a wave has ended: after a wave onset, activity must decrease below a chosen burden breakpoint for a specified number of consecutive time steps. Once a wave has ended, a new wave may start if the seasonal onset criteria are met again.
The combined_seasonal_output() function implements this
functionality via:
- : Logical. Should multiple waves be estimated within each season?
-
:
Character. The burden breakpoint that observations must fall below
before a subsequent increase can be interpreted as the start of a new
wave (provided onset criteria are met). Choose one of
"very low","low","medium", or"high". -
:
Integer. The number of consecutive time steps (days, weeks, months) with
decreasing observations while below
burden_level_decreaserequired to declare a wave end and start searching for the next wave onset.
Applying the multiple waves algorithm
As an example we first generate cases in a tsd object,
with the generate_seasonal_data() function. Then we rescale
time from monthly to weekly observations to get multiple waves.
set.seed(222)
tsd_data_monthly <- generate_seasonal_data(
  years = 14,
  phase = 3,
  start_date = as.Date("2020-05-18"),
  noise_overdispersion = 5,
  time_interval = "months"
)

tsd_data <- to_time_series(
  cases = tsd_data_monthly$cases,
  time = seq.Date(
    from = as.Date("2020-05-18"),
    by = "week",
    length.out = length(tsd_data_monthly$cases)
  )
) |>
  dplyr::filter(time < as.Date("2023-05-22"))
plot(tsd_data)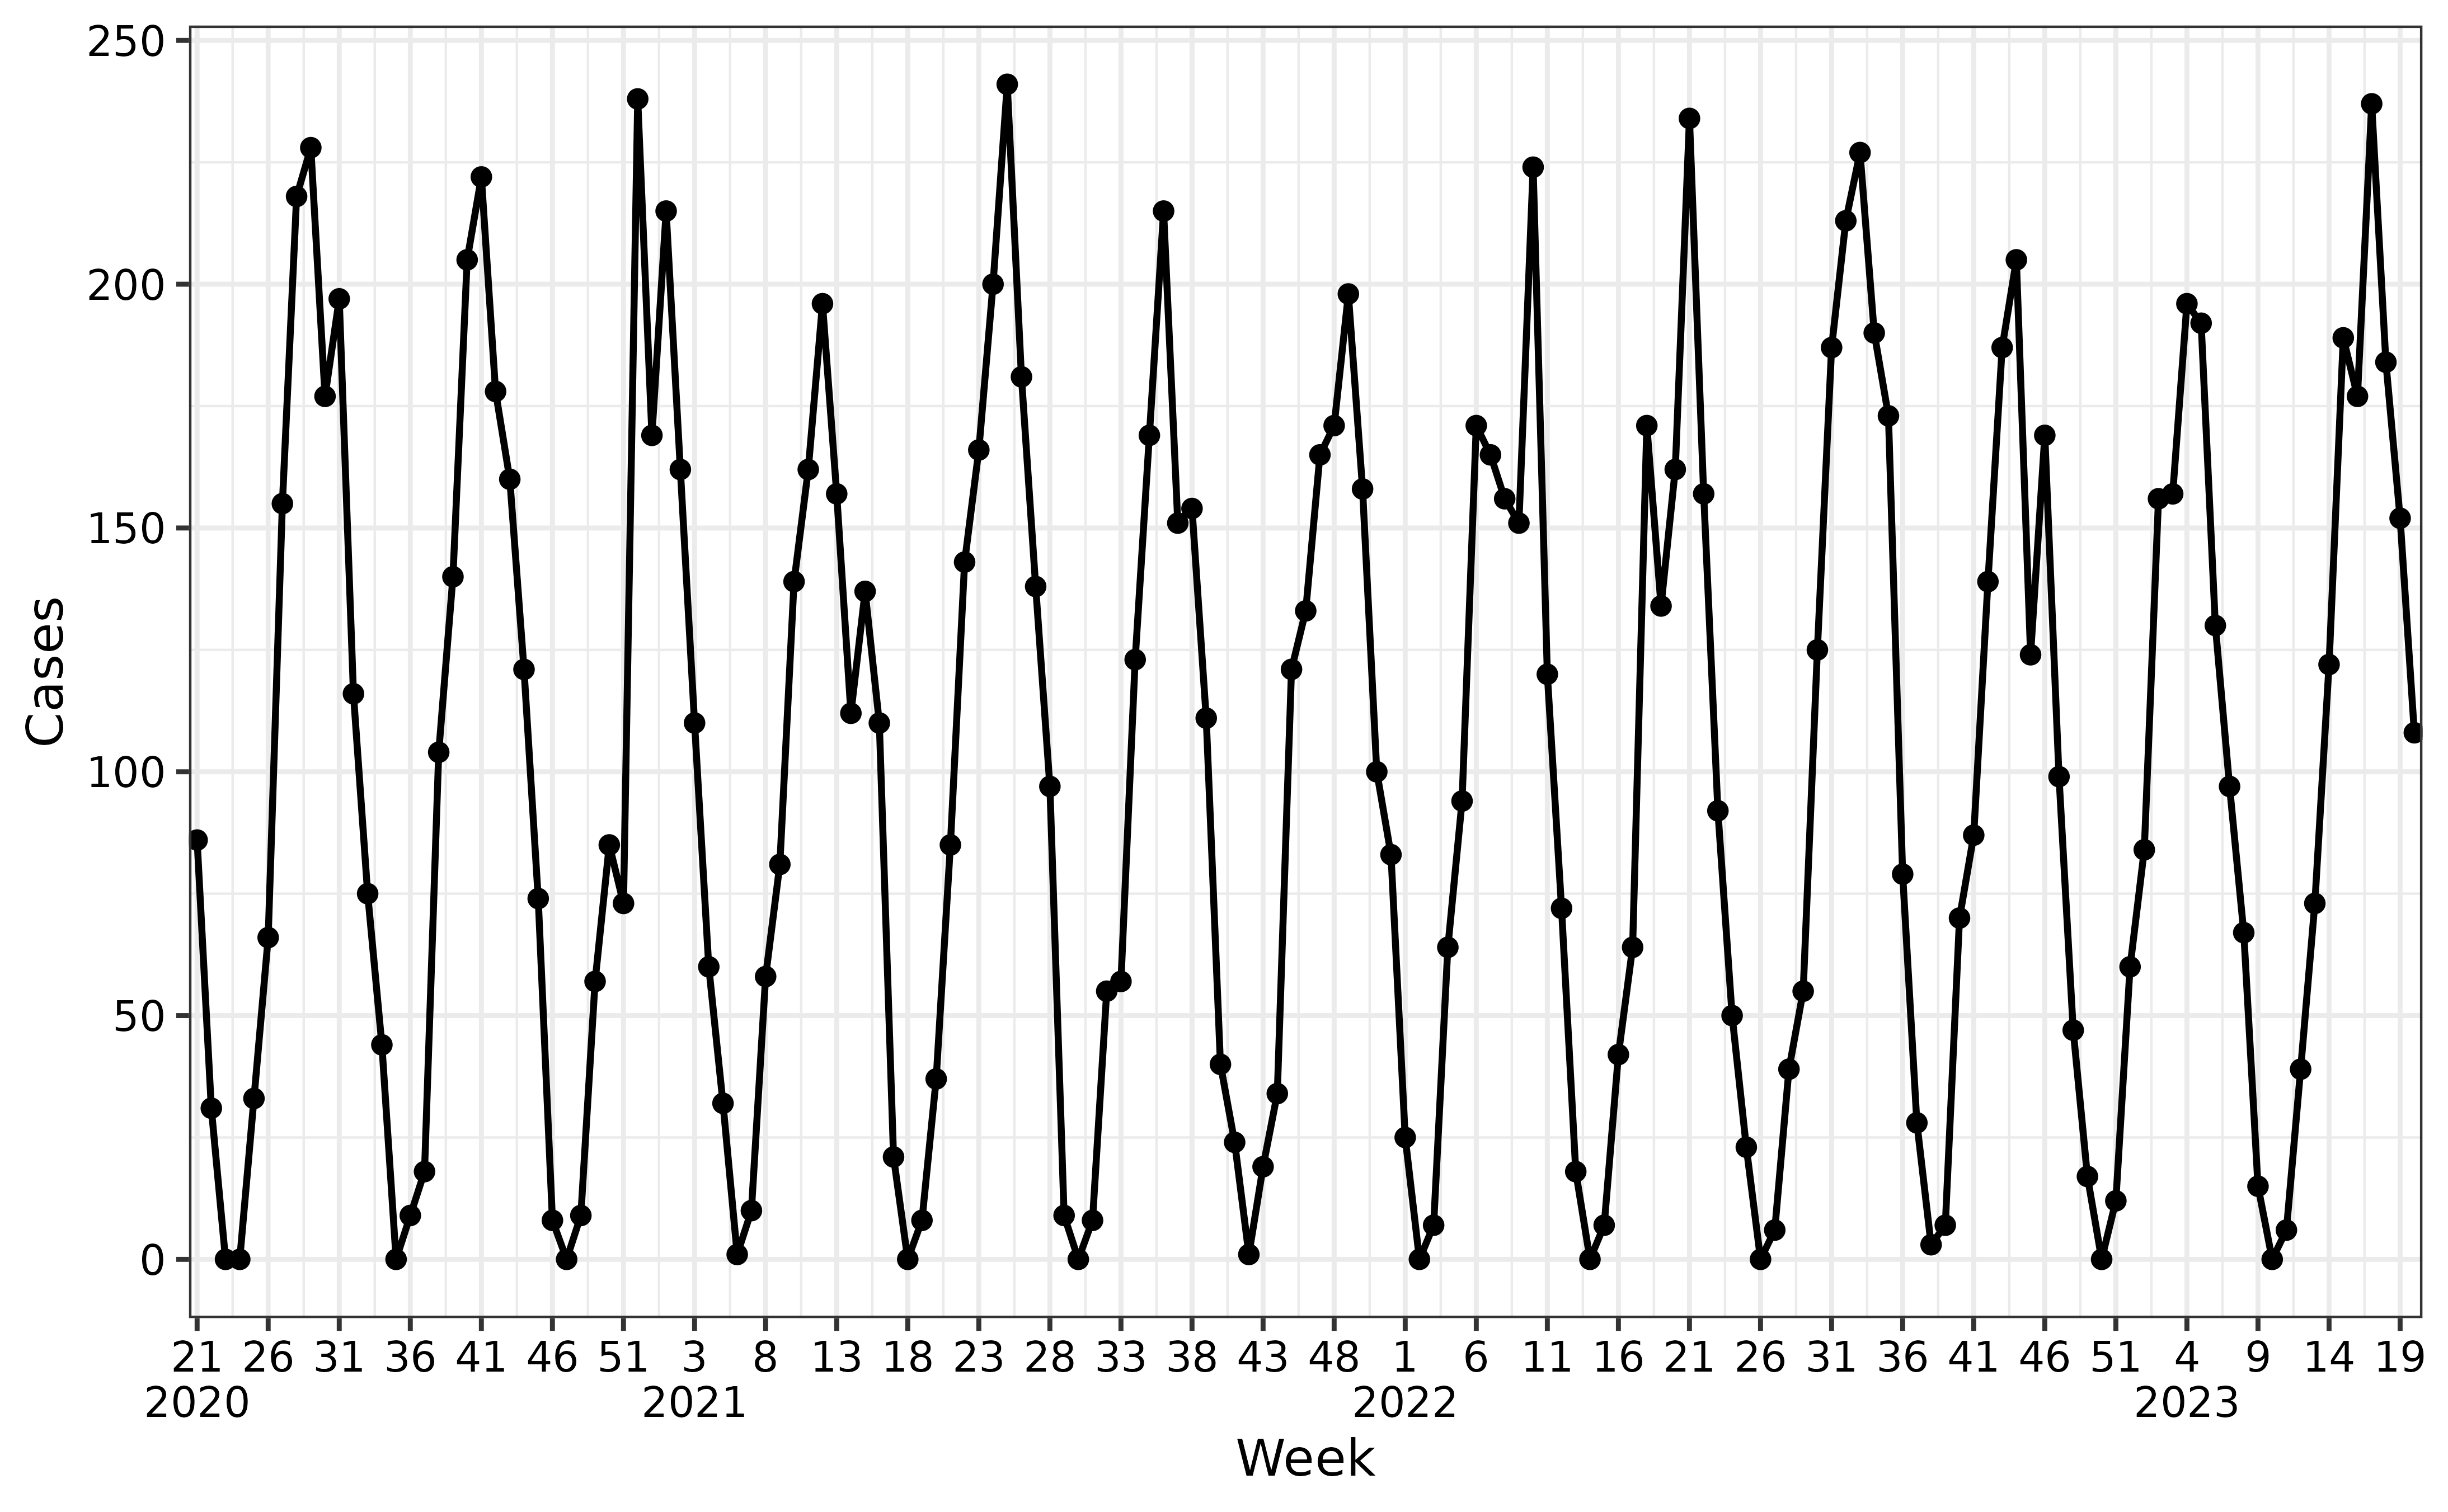
Estimate disease-specific threshold
Then we estimate the disease-specific threshold.
disease_threshold <- estimate_disease_threshold(tsd_data)
disease_threshold$disease_threshold
#> [1] 30.37079
Estimate multiple waves
Multiple waves are estimated such that after a wave onset,
observations have to decrease below the low intensity level
for two time steps to end the wave. A new wave can then start if
observations fulfill the seasonal onset criteria.
multiple_waves <- combined_seasonal_output(
  tsd_data,
  disease_threshold = disease_threshold$disease_threshold,
  multiple_waves = TRUE,
  burden_level_decrease = "low",
  steps_with_decrease = 2
)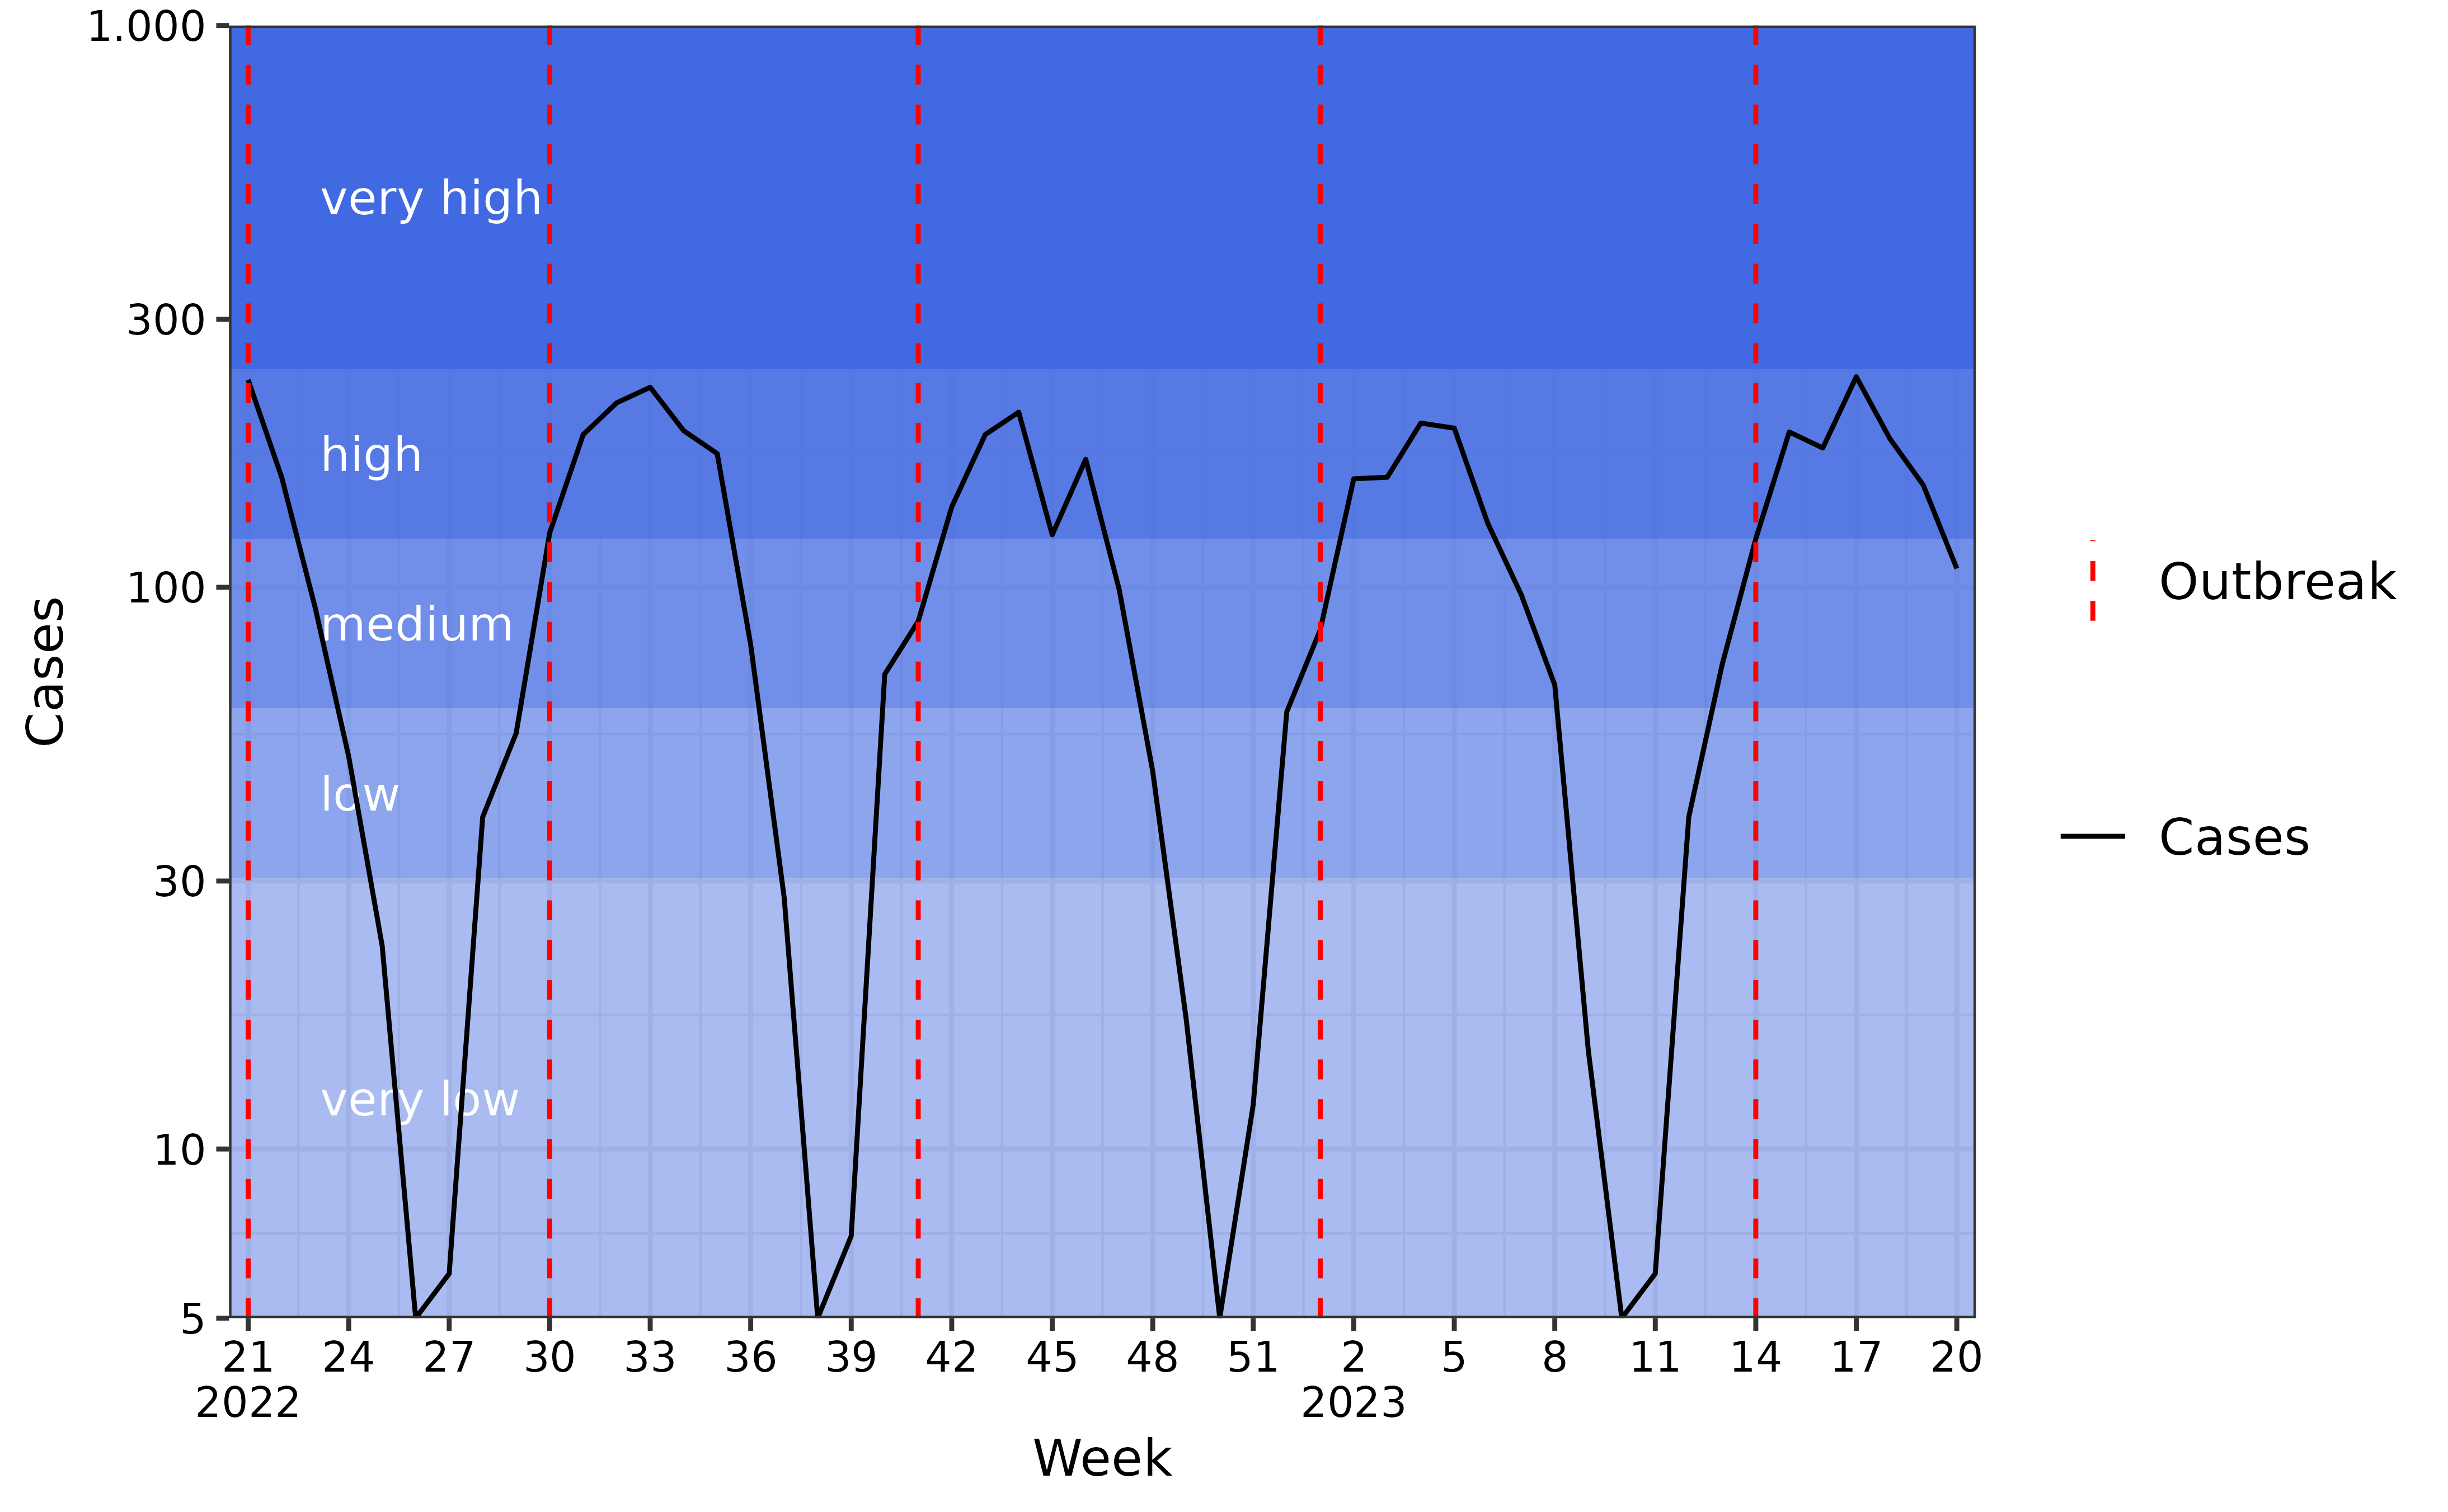 From the plot we can observe that season 2023/2024 has five starting
waves and four ending waves.
From the plot we can observe that season 2023/2024 has five starting
waves and four ending waves.